Analyzing results
To analyze the results the numpy and scipy packages of Python are used. For even more functionality the statistical package pandas can be used, but that is not included in this documentation.
In all examples at this page a typical VanDerPol simulation is assumed to be run first:
from pysim.simulation import Sim
from pysim.systems import VanDerPol
import matplotlib.pyplot as plt
import numpy as np

sim = Sim()
sys = VanDerPol()
sys.store("x")
sim.addSys(sys)

sim.simulate(20,0.1)
time = np.arange(0,20,0.1)

x = sys.res.x
The stored values are saved as numpy arrays so all methods that can be used on numpy arrays can be used on the results. It is for example possible, and often useful, to slice an array to efficiently get a subset of it.
Say that you have an result x then you can get the first five values of that array by slicing it
>>> x[:5]
array([ 1. , 1.0994475 , 1.19490544, 1.28069498, 1.34919295])
It is also possible to get the last five values
>>> x[-5:]
array([ 1.56819423, 1.74261745, 1.93952537, 2.15280207, 2.3669469 ])
To get the maximum or minimum of an array you can use its max and min function
>>> x.max()
2.6762298217379024
>>> x.min()
-2.6780402033754451
To get the index of the max value use argmax
>>> x.argmax()
135
>>> x[135]
2.6762298217379024
>>> time[135]
13.5
Plotting
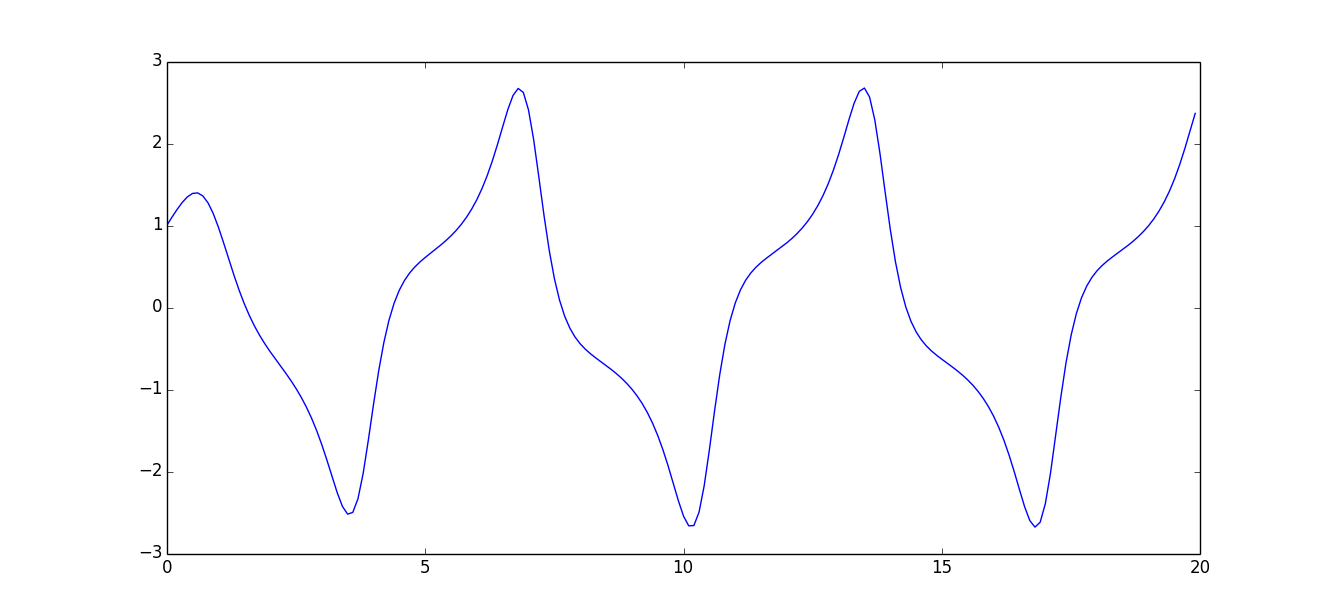
To plot a graph use the matplotlib plot function.
>>> plt.plot(time,x)
>>> plt.show()
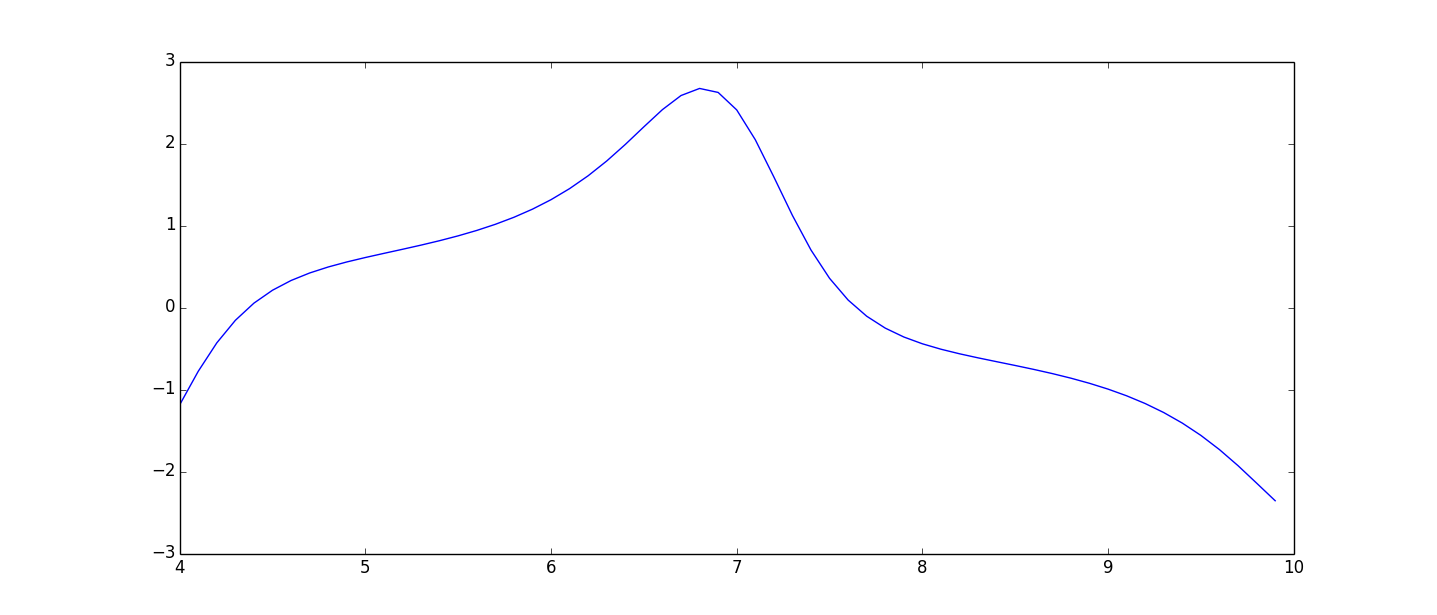
It is also possible to plot a subset of the values by using slicing.
>>> plt.plot(time[40:100],x[40:100])
>>> plt.show()
- Finally, lets att some more information to the plot
>>> plt.plot(time,x)
>>> plt.xlabel('time')
>>> plt.ylabel('x')
>>> plt.title('Van Der Pol Oscillations')
>>> plt.grid()
>>> plt.show()
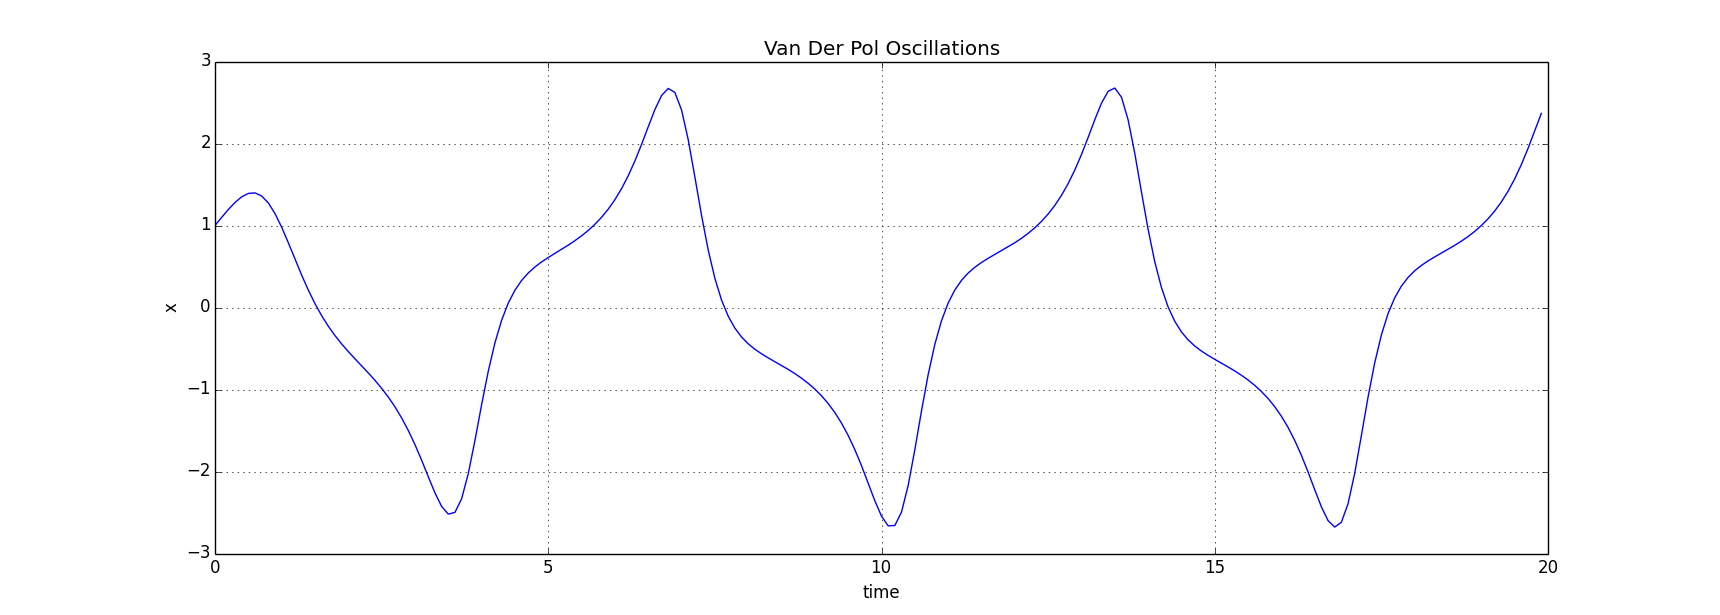
This is just an introduction to the matplotlib. To proceed from here have a look at their tutorial.